Reporting System
A large variety of built-in reports, graphs and charts are provided that cover any period of time such as a day, week, month or year. In addition to focusing on current results, reports and graphs show comparisons to the same period last year, plans and budgets. By using easy to follow wizards, on-demand reports and graphs can be viewed on screen, printed or saved as Microsoft Excel, Access and many other file types.
ProRep’s integrated visual report writer enables users to modify the built-in reports or create completely new reports. The report writer’s drag and drop environment is specifically designed to enable users to easily create reports that provide the business insight needed by operations management.
Every associate and all levels of management are provided continual feedback about the results of their efforts. Consolidations and roll-ups are easily produced so that each level of management can analyze their own results. For companies with multiple locations, the data from each facility can be automatically imported into a central ProRep system from which reports and graphs that consolidate and compare results from all locations are available.
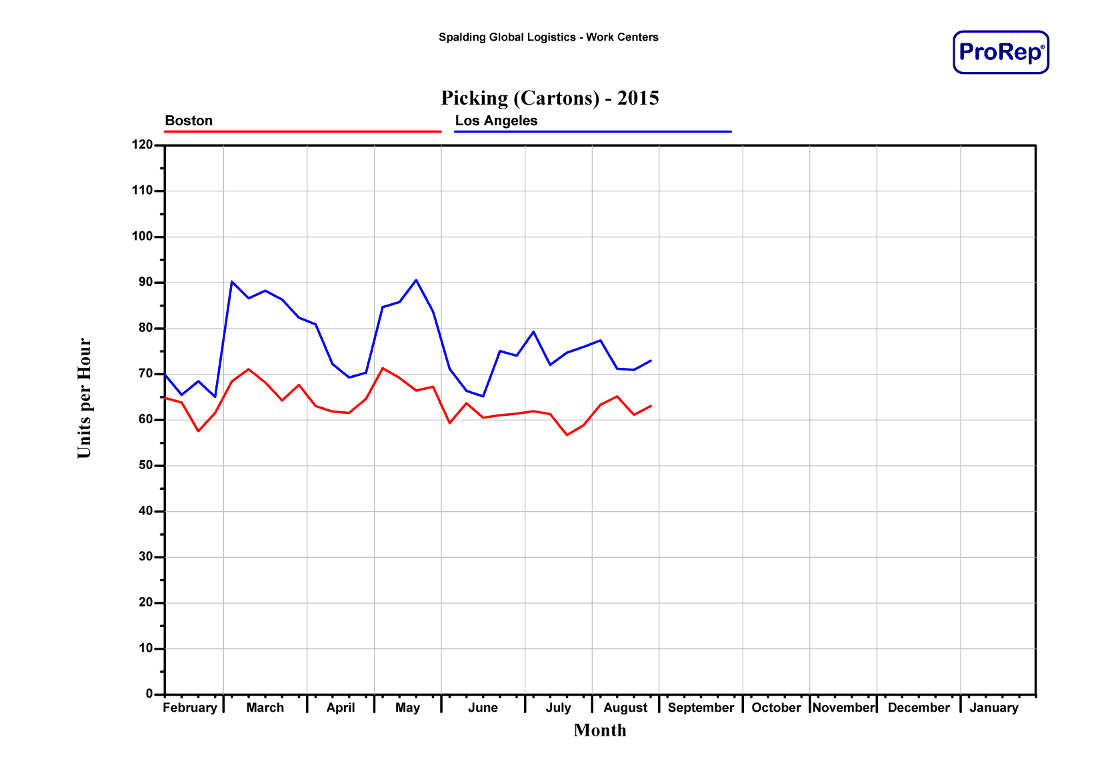
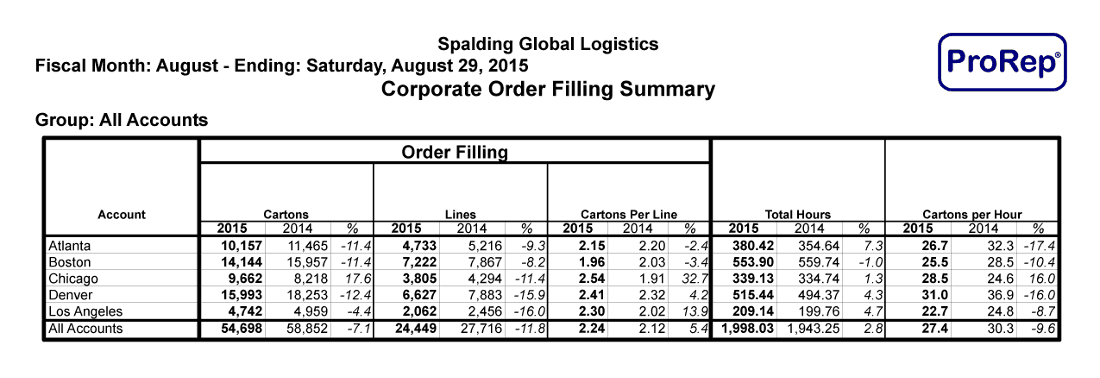
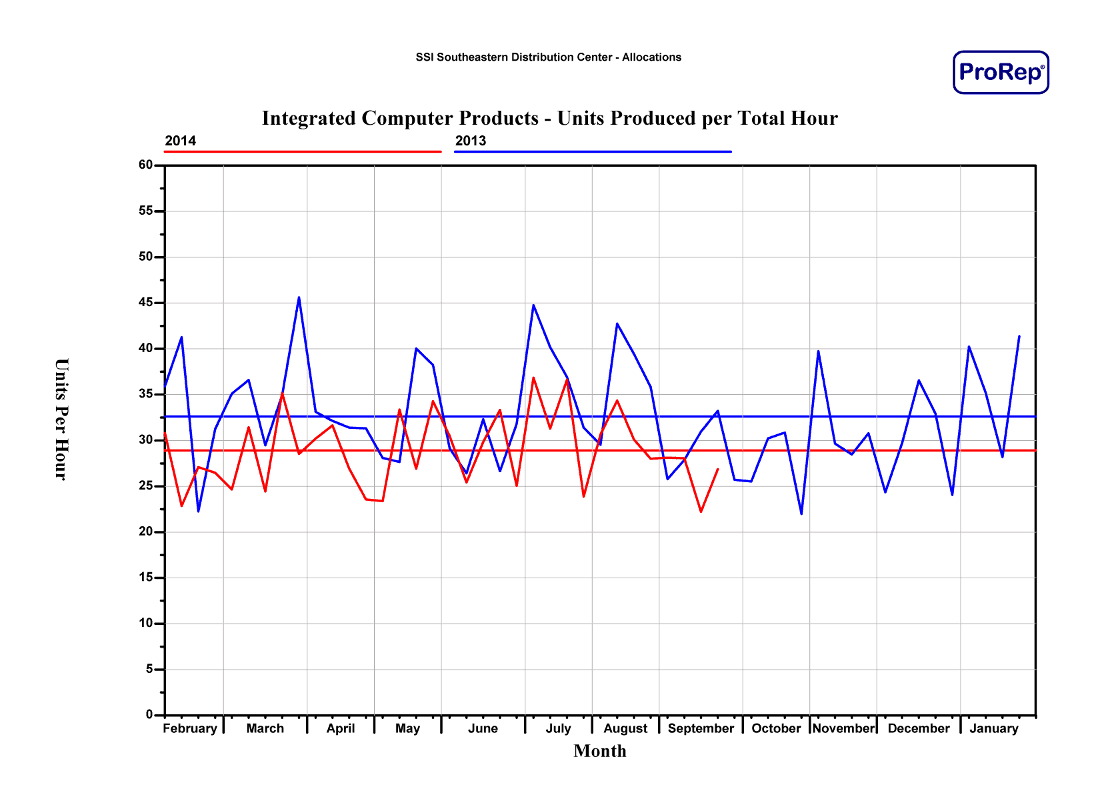
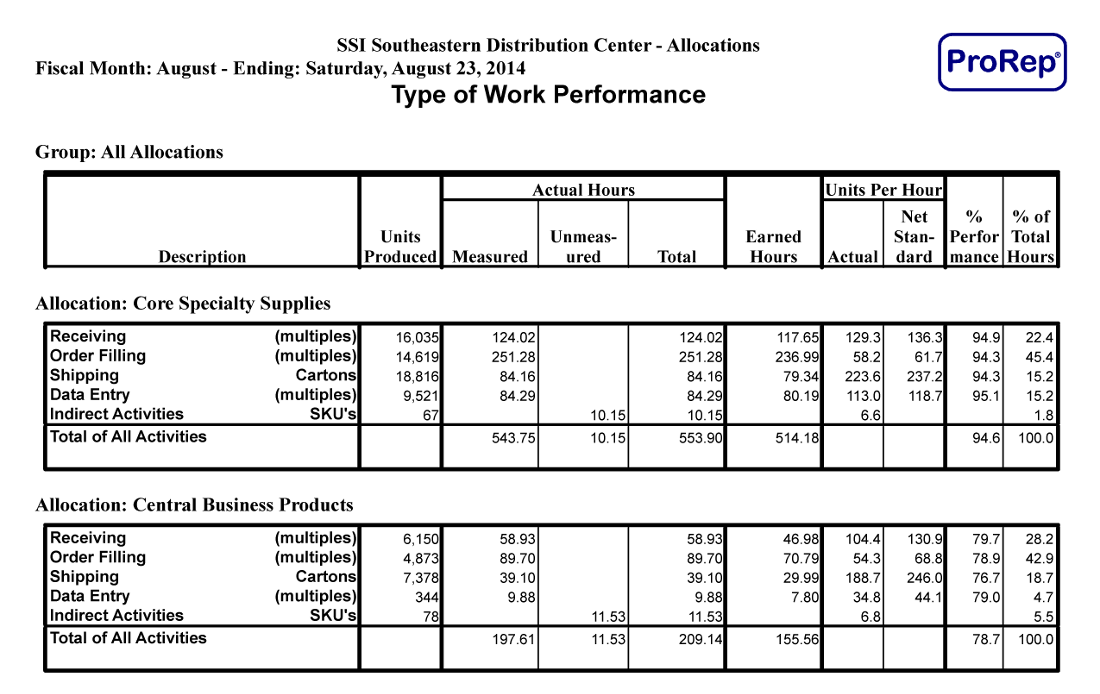
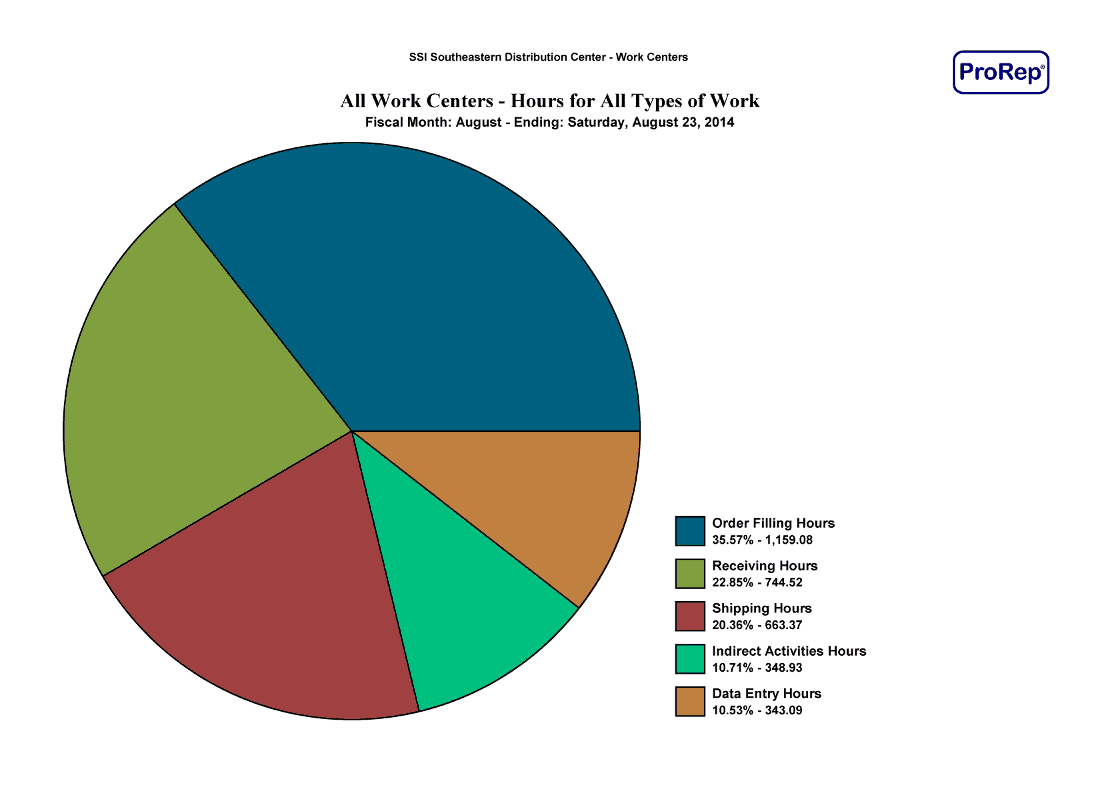
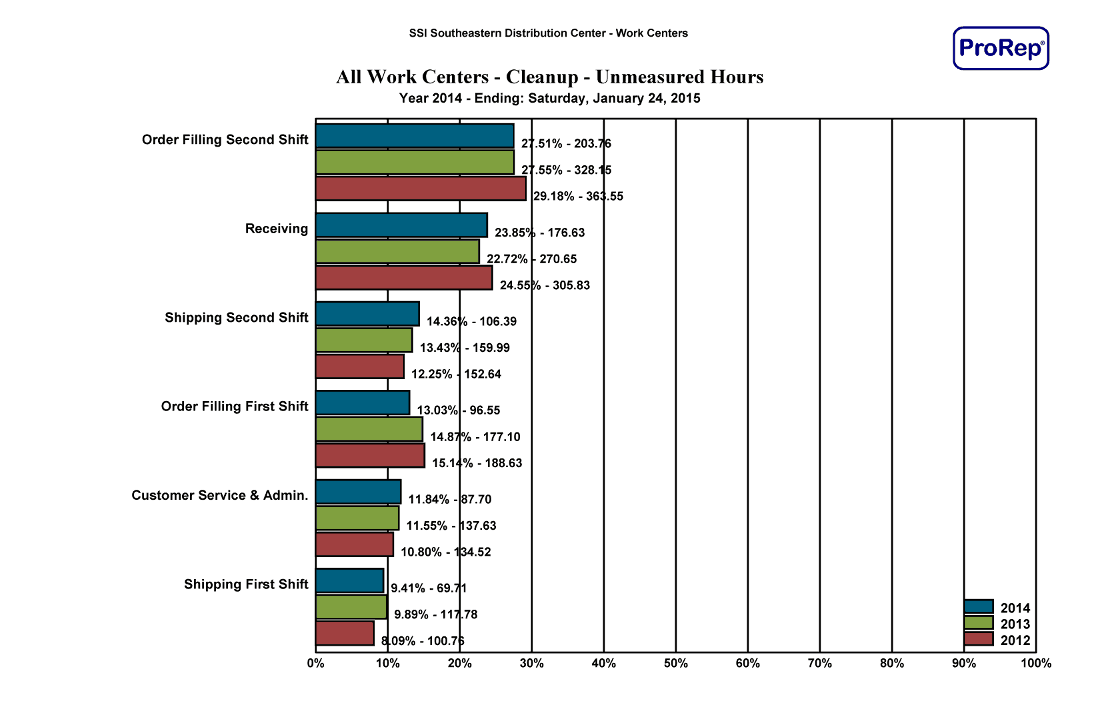
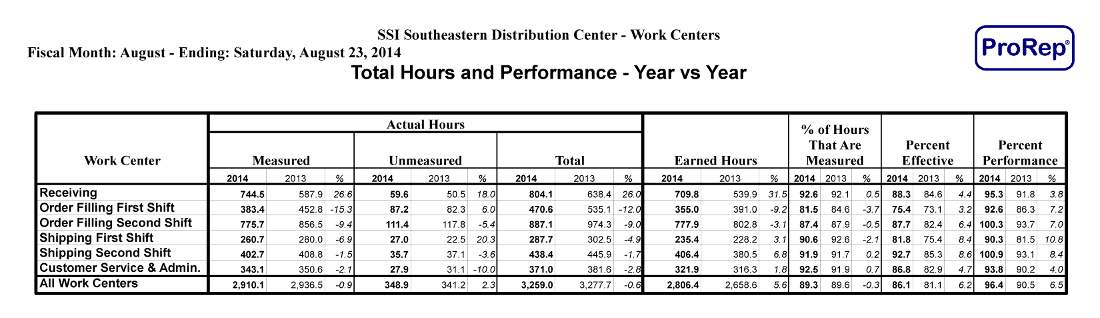
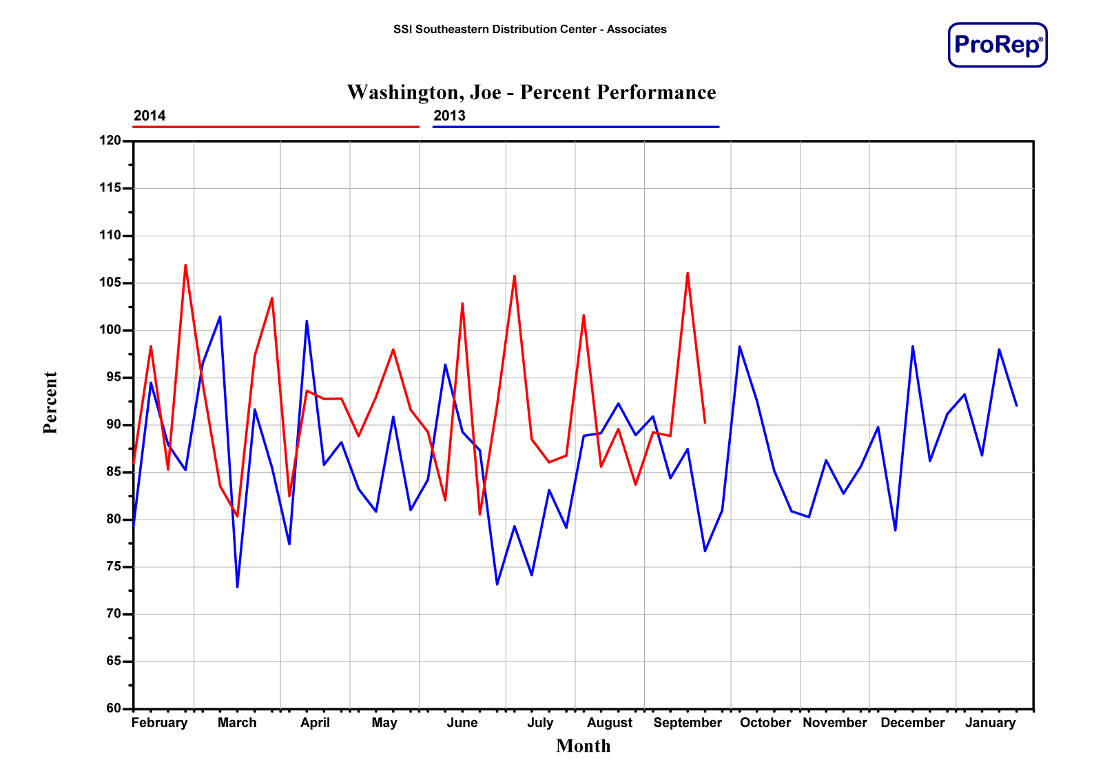
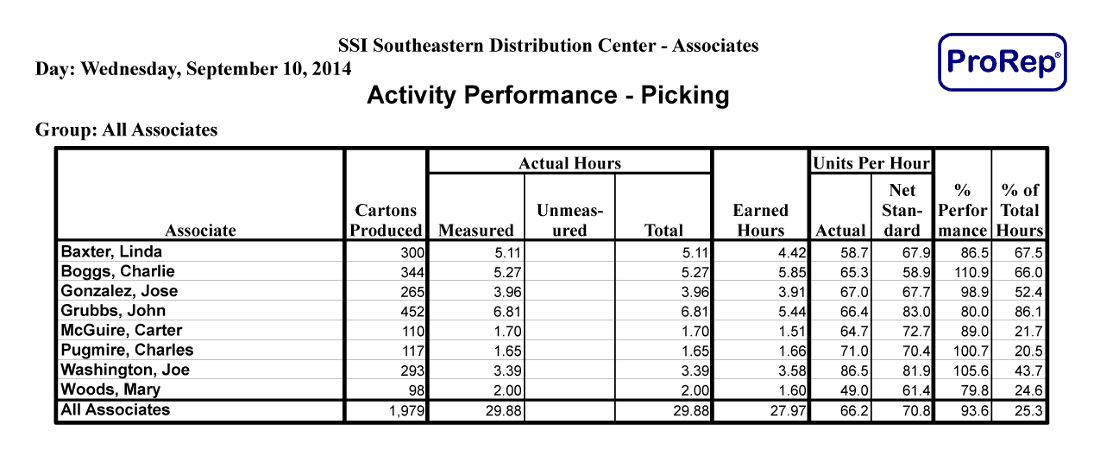
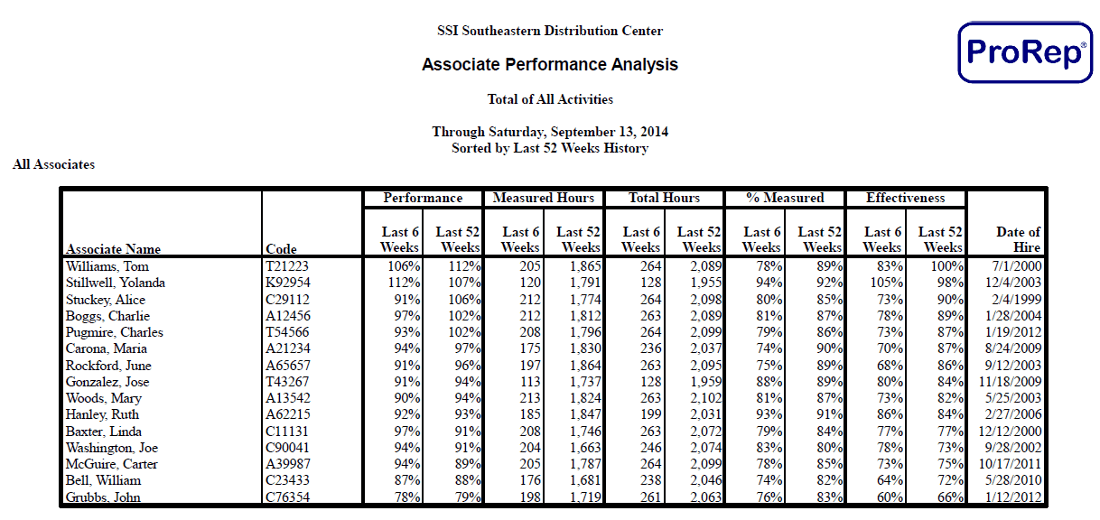
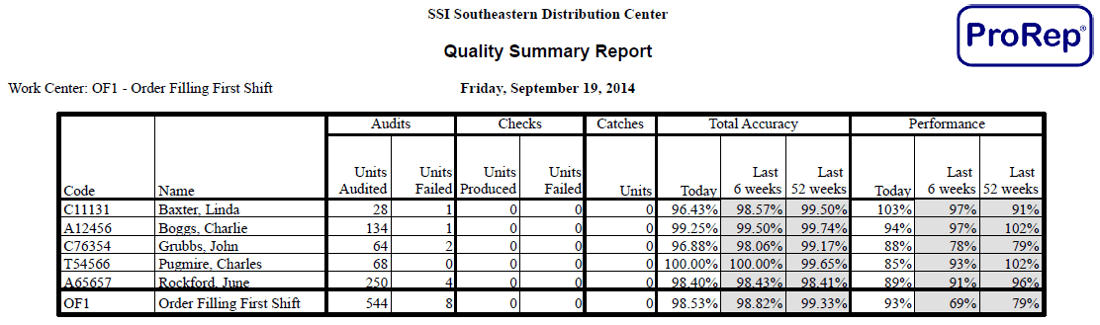
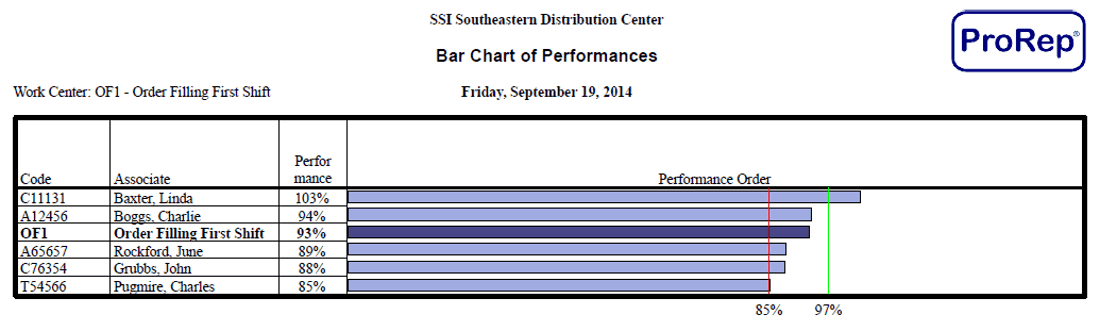
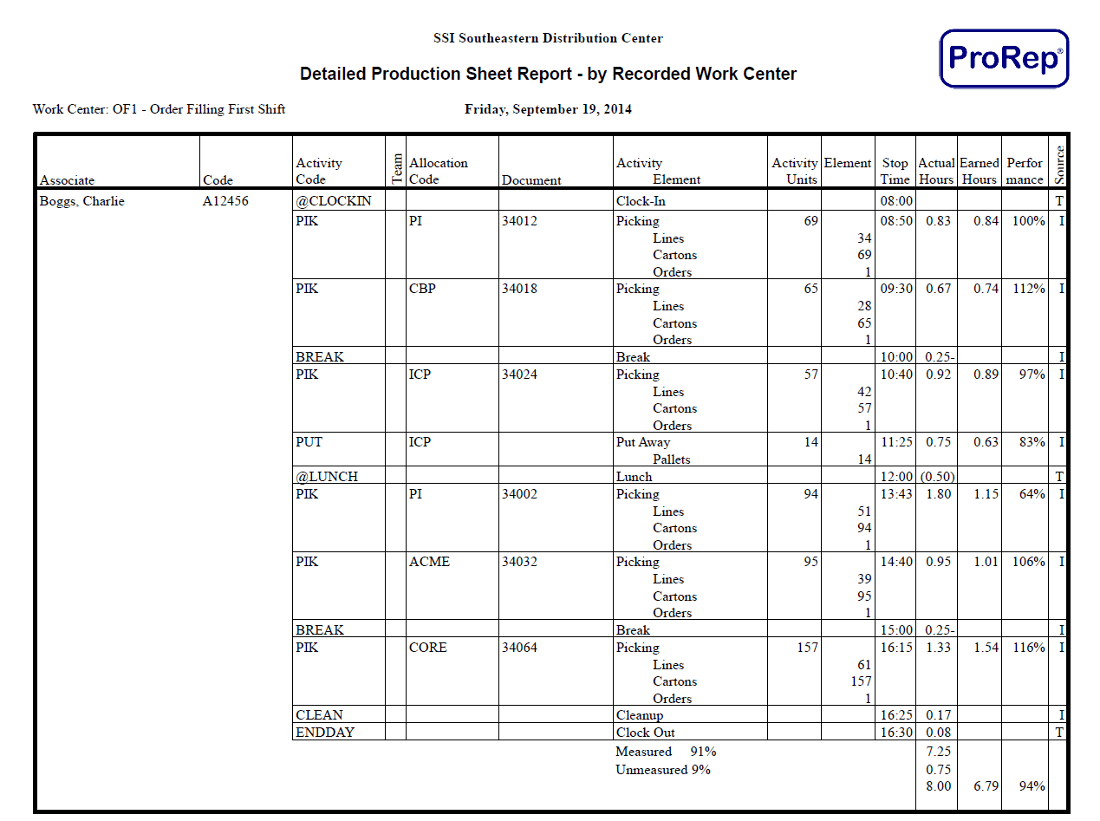
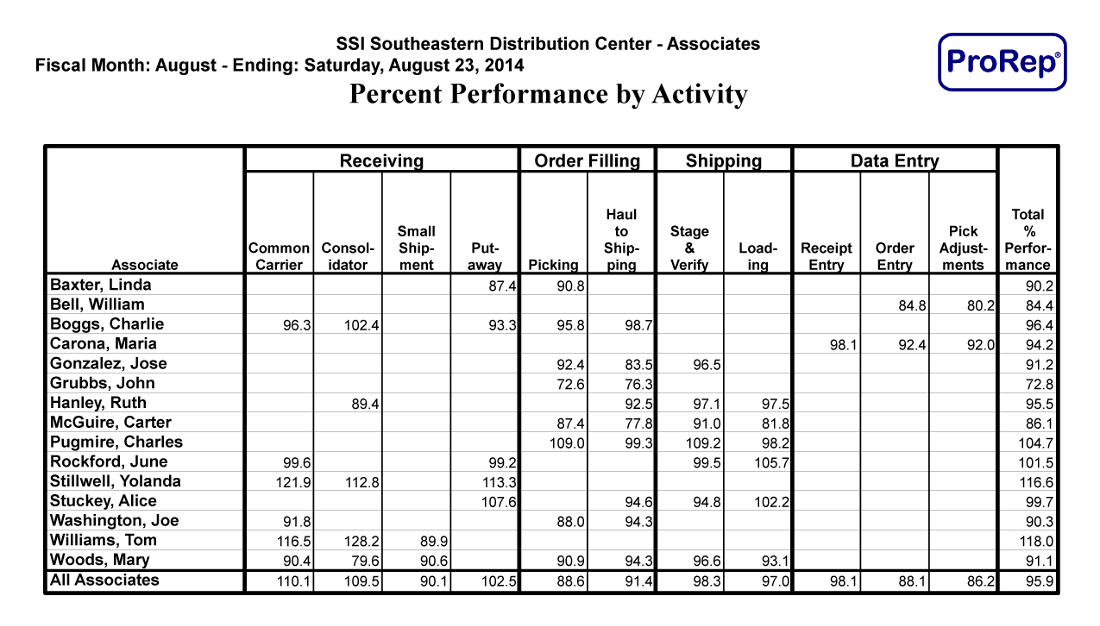
Below are various examples of reports and charts that ProRep can generate. These reports and charts, as well as additional ones, are included in the ProRep Overview listed in the ProRep Resources & Test Drive section of this site.