
Example #1
Suppose you have a lengthy report and you’re only interested in pulling out data that meets certain criteria. You can tell DataImport to extract only rows that contain the word “Chicago” or only rows where the amount is over $10,000. It can even pull data up from a footer, such as a total line, and put it on the lines above it. Or, take data from a section heading and put it on the lines below it. DataImport neatly extracts all of the data, rearranges it, and places it into the spreadsheet columns or database fields that you specify.
Example #2
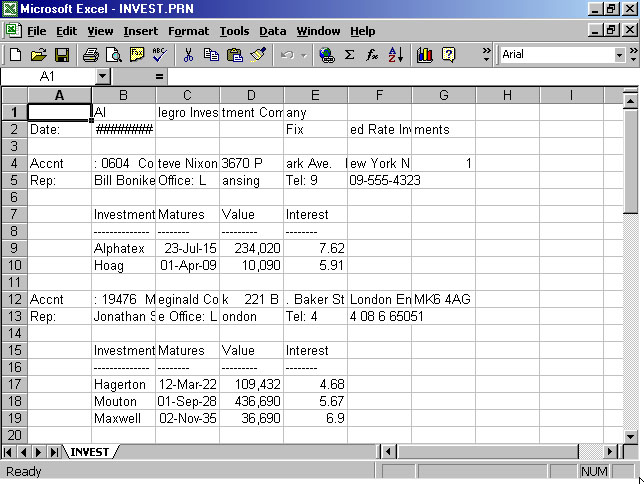
Here’s a typical data mining problem. Below is a report we will use as an example.
")
The report is a list of customers, accounts and each investment in the account.
Let’s take a close up look at the data we would like to mine form this report.
")
We need customer information for each account. The customer data is highlighted in yellow on the above report.
We also need the data for each of the customer’s investments. This data is highlighted in pink, green and blue on the above report. Note that there are multiple lines of investment data for each customer account.
When we are finished we want one line of data in an Excel spreadsheet for each investment. We want each line to contain both the investment data and the customer data as shown below.
")
First, let’s try opening the text report file in Excel.

The text import wizard is the tool that Microsoft Excel provides for the purpose of parsing lines of text data into separate columns. When we open the file in Excel, the Text Import Wizard as shown above is displayed. The wizard limits us to defining one set of columns to be applied throughout the report.
When imported into Excel, the data is not much more usable than it was in the text file. It would take a lot of work in Excel to solve this problem.
This data mining problem is easily solved with DataImport.
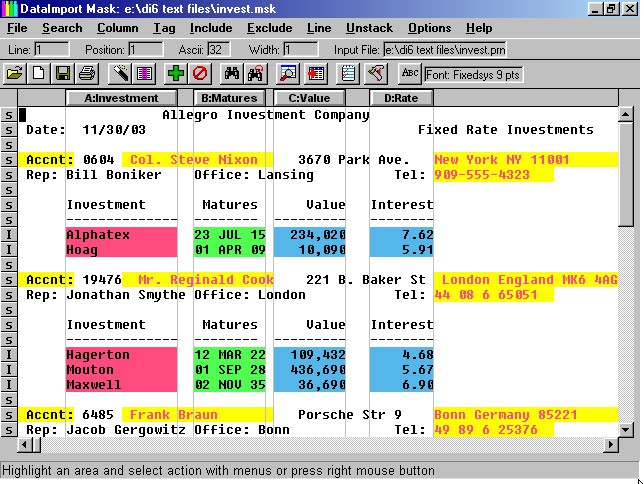
In DataImport, with your report or other file displayed on the screen as shown above, you highlight the data that you want to extract into your spreadsheet or database. The various highlighter colors are a visual confirmation of the data that is selected and how it will be translated. In fact, Highlighter pens were the inspiration for the DataImport user interface.
DataImport quickly unscrambles and translates the data directly into your chosen spreadsheet or database file format.
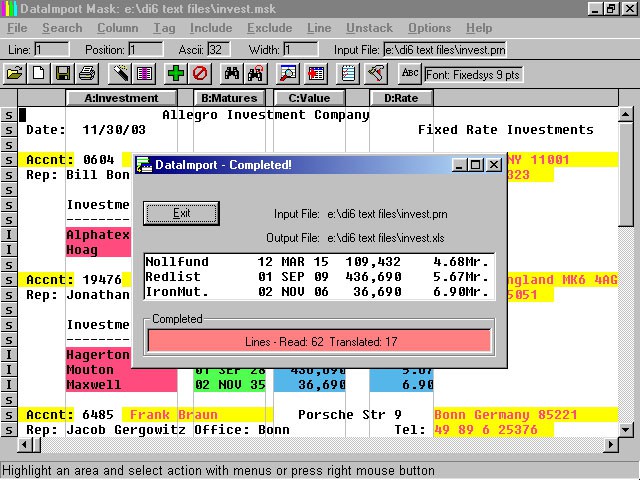
The file created by DataImport can be immediately opened in Excel, Access or other target application.
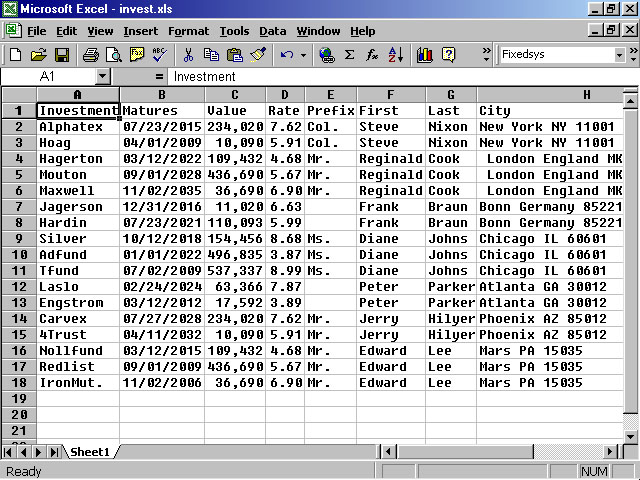
When opened in Excel (as shown above) names are parsed into separate columns, numbers, currency and dates are in their correct format. DataImport avoids hours of tedious cleanup work and unlocks data that was previously hopelessly trapped in report fields.
Supported File Types
Microsoft Excel 2.1, 3.0, 4.0, 5.0, 7.0, 97, 2000, XP, 2007 (.xlsx)
- Microsoft Access 1.1, 2.0, 3.0, 97, 4.0, 2000, XP
- XML Table
- HTML Table
- dBase II, III, IV
- Lotus 1-2-3 1A, 2.0, 3.0, 4.0, 5.0
- ASCII
- Comma Separated Value
- Delimited Text
- User-Defined Delimited
- Tab Separated Variable
- Fixed Field Text
- Mailing Label
- Clarion
- Microsoft Word Merge
- Quattro Pro 5.0
- Sylk
- Symphony 1.0, 1.1
- WordPerfect Merge 5.0, 5.1
- Columnwise DIF
- Named Value